

#有监督学习,机器学习,模型训练,推荐系统#百香果AI山海 公众号AI生成并修订#学习内容:数据集(训练集、验证集、测试集)、模型训练、模型评估)# 模块1:导入相应的库importnumpyasnp# 用于生成随机数据importpandasaspd# 用于数据处理fromsklearn.model_selectionimporttrain_test_split# 用于将数据分为训练集和测试集fromsklearn.ensembleimportRandomForestClassifier# 随机森林分类器fromsklearn.metricsimportaccuracy_score, classification_report, confusion_matrix# 用于模型评估importmatplotlib.pyplotasplt# 用于可视化importseabornassns# 用于更美观的可视化frommatplotlib.font_managerimportFontProperties #导入字体功能ft = FontProperties(fname=r'中文字体.ttf', size=16) #设置自定义字体文件和字号plt.rcParams['axes.unicode_minus'] =False# 解决负号显示问题#模块2:定义菜品推荐系统类(封装)classFlavorRecommender:# 菜品推荐系统类(封装) def__init__(self):# 初始化方法 self.model = RandomForestClassifier(n_estimators=100, random_state=42)# 初始化随机森林分类器模型 self.dishes = self.DATA0()# 创建菜品标准数据库(调用自定义函数的方法) self.train_accuracy = [] # 存储每轮训练的训练准确率 self.val_accuracy = [] # 存储每轮训练的验证准确率 self.test_accuracy = [] # 存储每轮训练的测试准确率 self.train_losses = [] # 存储每轮训练的训练损失 self.val_losses = [] # 存储每轮训练的验证损失 self.test_losses = [] # 存储每轮训练的测试损失 defDATA0(self):# 创建菜品数据库(方法) """创建菜品数据库,包含各种菜品的酸、甜、辣特征""" dishes = [ {"name":"宫保鸡丁","sour":2,"sweet":3,"spicy":3}, {"name":"鱼香肉丝","sour":3,"sweet":3,"spicy":2}, {"name":"麻婆豆腐","sour":1,"sweet":1,"spicy":5}, {"name":"糖醋排骨","sour":4,"sweet":5,"spicy":1}, {"name":"水煮鱼","sour":1,"sweet":1,"spicy":5}, {"name":"番茄炒蛋","sour":3,"sweet":2,"spicy":1}, {"name":"回锅肉","sour":1,"sweet":1,"spicy":3}, {"name":"酸辣土豆丝","sour":4,"sweet":1,"spicy":3}, {"name":"糖醋鱼","sour":4,"sweet":4,"spicy":1}, {"name":"重庆火锅","sour":1,"sweet":1,"spicy":5}, {"name":"酸菜鱼","sour":3,"sweet":1,"spicy":4}, {"name":"蜜汁叉烧","sour":1,"sweet":5,"spicy":1}, ] returnpd.DataFrame(dishes) defDATA(self, n_samples=1000):# 生成训练数据,构成训练集 """生成模拟的训练数据:用户对不同酸、甜、辣程度的偏好""" # 随机特征数据:样本数实际可调整,每个样本3个特征(酸、甜、辣) X = np.random.randint(1,6, size=(n_samples,3)) # 目标分类变量:基于一定规则的喜好程度(0-不喜欢,1-喜欢),作为标签(有监督学习) # 这里使用简单规则模拟:喜欢程度与个人偏好匹配度相关,自动提取标签。 y = []#记录样本的标签 foriinrange(n_samples): # 为每个样本随机生成一个"偏好类型" preference_type = np.random.choice(["sour_lover","sweet_lover","spicy_lover","balanced"]) sour, sweet, spicy = X[i] # 根据偏好类型决定是否喜欢 ifpreference_type =="sour_lover"andsour >=3:# 如果是酸爱好者且酸程度大于等于3 y.append(1)# 设置喜欢标签1 elifpreference_type =="sweet_lover"andsweet >=3: y.append(1) elifpreference_type =="spicy_lover"andspicy >=3: y.append(1) elifpreference_type =="balanced"andabs(sour - sweet) <=1andabs(sour - spicy) <=1: y.append(1) else: y.append(0)# 其他情况设置不喜欢标签0 returnX, np.array(y)# 返回特征矩阵X和标签数组y deftrain(self, X, y, epochs=10):# 训练模型,默认训练10轮(减少轮数避免过长时间) # 初始化损失列表 self.train_losses = [] self.val_losses = [] self.test_losses = [] self.train_accuracy = [] self.val_accuracy = [] self.test_accuracy = [] # 设置动态绘图 plt.ion() # 开启交互模式 fig, (ax1, ax2) = plt.subplots(1,2, figsize=(15,6)) # 创建两个子图 forepochinrange(epochs): print(f"
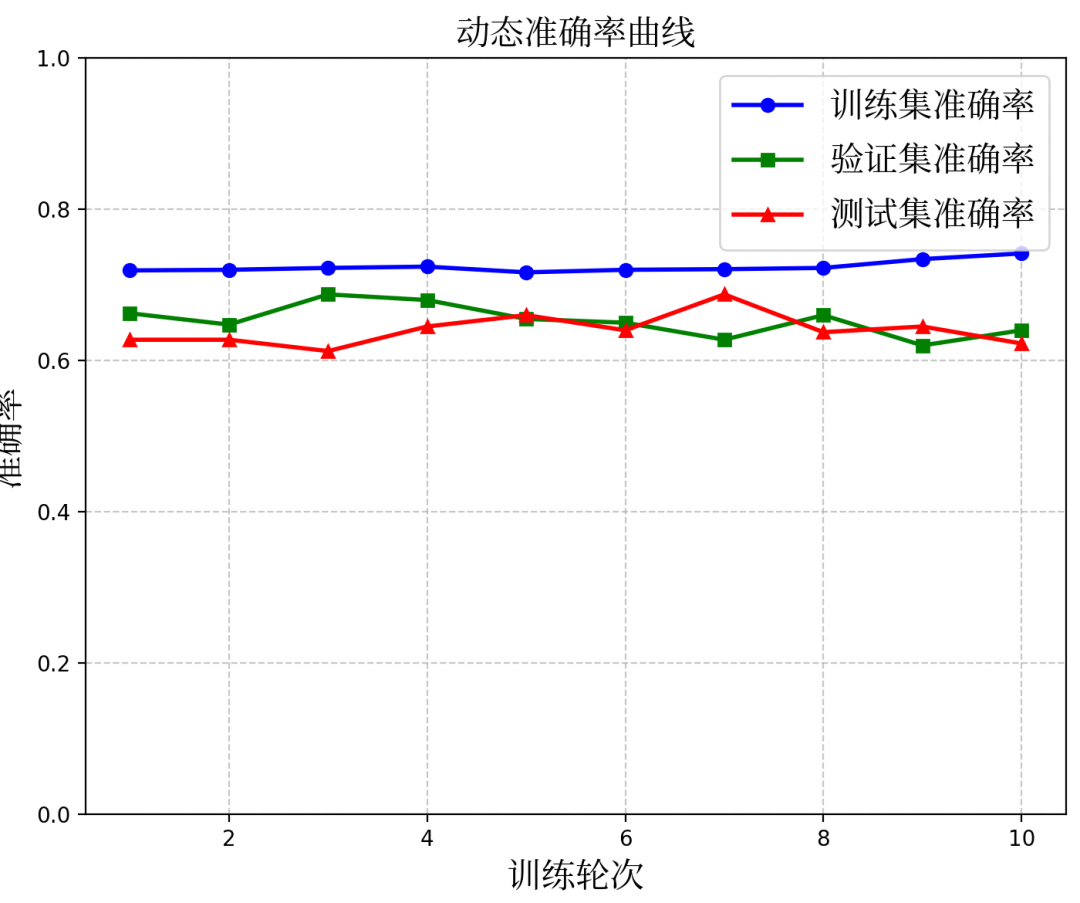
=== 第{epoch +1}轮训练 ===") # 首先分割为训练集(80%)+验证集(20%)和测试集(预测数据数量不定) X_train_val, X_test, y_train_val, y_test = train_test_split( X, y, test_size=0.2, stratify=y)#禁用random_state=42,可复杂化 # 再将训练+验证集分割为训练集(75%)和验证集(25%) X_train, X_val, y_train, y_val = train_test_split( X_train_val, y_train_val, test_size=0.25, stratify=y_train_val) print(f"数据集划分情况:") print(f"训练集样本数:{len(X_train)}") print(f"验证集样本数:{len(X_val)}") print(f"测试集样本数:{len(X_test)}") # 训练模型 self.model.fit(X_train, y_train) # 评估训练集 y_train_pred = self.model.predict(X_train) train_accuracy = accuracy_score(y_train, y_train_pred) self.train_accuracy.append(train_accuracy) train_loss =1- train_accuracy self.train_losses.append(train_loss) # 评估验证集 y_val_pred = self.model.predict(X_val) val_accuracy = accuracy_score(y_val, y_val_pred) self.val_accuracy.append(val_accuracy) val_loss =1- val_accuracy self.val_losses.append(val_loss) # 评估测试集(最终评估) y_test_pred = self.model.predict(X_test) test_accuracy = accuracy_score(y_test, y_test_pred) self.test_accuracy.append(test_accuracy) test_loss =1- test_accuracy self.test_losses.append(test_loss) print(f"训练集准确率:{train_accuracy:.4f}, 损失:{train_loss:.4f}") print(f"验证集准确率:{val_accuracy:.4f}, 损失:{val_loss:.4f}") print(f"测试集准确率:{test_accuracy:.4f}, 损失:{test_loss:.4f}") epochs_range =range(1, epoch +2) # 更新损失曲线图 ax1.clear() ax1.plot(epochs_range, self.train_losses,'b-', label='训练集损失', marker='o', linewidth=2) ax1.plot(epochs_range, self.val_losses,'g-', label='验证集损失', marker='s', linewidth=2) ax1.plot(epochs_range, self.test_losses,'r-', label='测试集损失', marker='^', linewidth=2) ax1.set_xlabel('训练轮次', fontproperties=ft) ax1.set_ylabel('损失值', fontproperties=ft) ax1.set_title('动态损失曲线', fontproperties=ft) ax1.legend(prop=ft) ax1.grid(True, linestyle='--', alpha=0.7) ax1.set_ylim(0,1) # 更新准确率曲线图 ax2.clear() ax2.plot(epochs_range, self.train_accuracy,'b-', label='训练集准确率', marker='o', linewidth=2) ax2.plot(epochs_range, self.val_accuracy,'g-', label='验证集准确率', marker='s', linewidth=2) ax2.plot(epochs_range, self.test_accuracy,'r-', label='测试集准确率', marker='^', linewidth=2) ax2.set_xlabel('训练轮次', fontproperties=ft) ax2.set_ylabel('准确率', fontproperties=ft) ax2.set_title('动态准确率曲线', fontproperties=ft) ax2.legend(prop=ft) ax2.grid(True, linestyle='--', alpha=0.7) ax2.set_ylim(0,1) plt.tight_layout() plt.draw() plt.pause(0.1) # 暂停一下以便观察更新 # 只在最后一轮显示详细的分类报告和混淆矩阵 ifepoch == epochs -1: # 显示详细的分类报告 print("
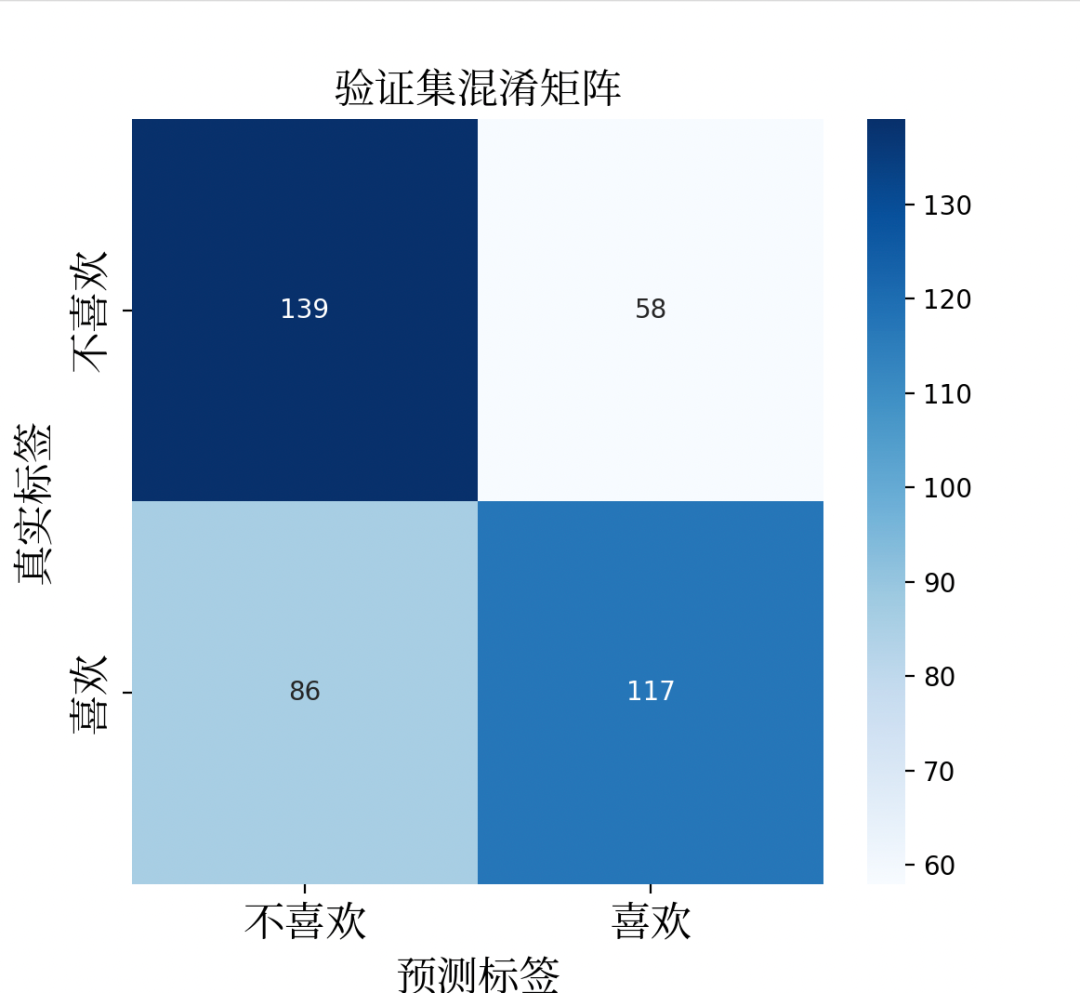
验证集详细分类报告:") print(classification_report(y_val, y_val_pred, target_names=['不喜欢','喜欢'])) # 可视化混淆矩阵 self.plot_confusion_matrix(y_val, y_val_pred,"验证集混淆矩阵") plt.ioff() # 关闭交互模式 plt.show() # 显示最终图表 # 计算平均准确率 avg_train_acc = np.mean(self.train_accuracy) avg_val_acc = np.mean(self.val_accuracy) avg_test_acc = np.mean(self.test_accuracy) print(f"
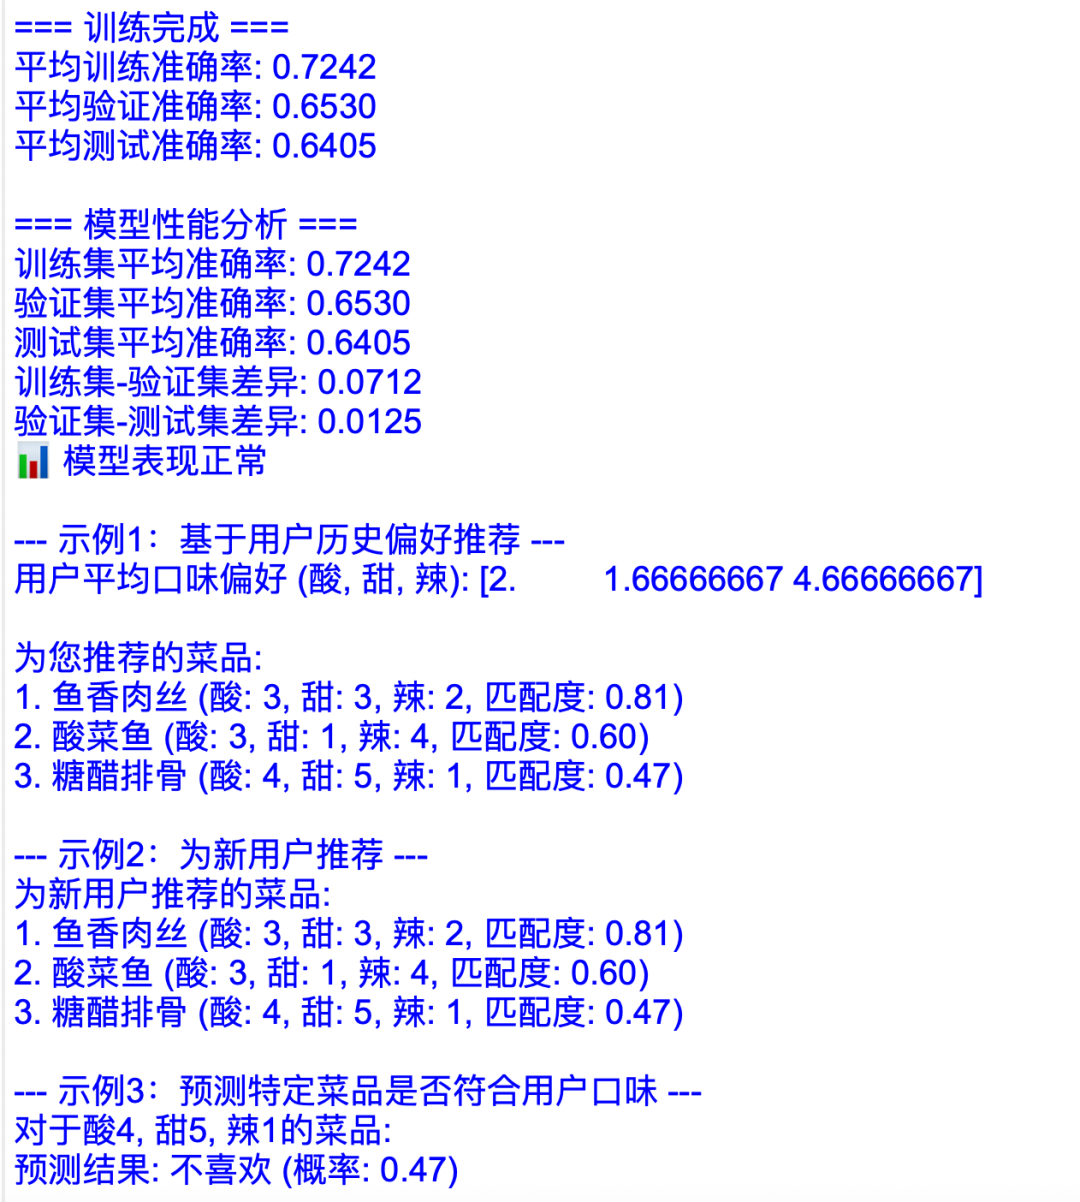
=== 训练完成 ===") print(f"平均训练准确率:{avg_train_acc:.4f}") print(f"平均验证准确率:{avg_val_acc:.4f}") print(f"平均测试准确率:{avg_test_acc:.4f}") returnavg_train_acc, avg_val_acc, avg_test_acc defplot_confusion_matrix(self, y_true, y_pred, title): """绘制混淆矩阵""" cm = confusion_matrix(y_true, y_pred) plt.figure(figsize=(6,5)) sns.heatmap(cm, annot=True, fmt='d', cmap='Blues', xticklabels=['不喜欢','喜欢'], yticklabels=['不喜欢','喜欢']) plt.yticks(fontproperties=ft) plt.xticks(fontproperties=ft) plt.xlabel('预测标签', fontproperties=ft) plt.ylabel('真实标签', fontproperties=ft) plt.title(title, fontproperties=ft) plt.show() defpredict(self, flavor_features): """预测用户对特定口味的偏好""" iflen(flavor_features.shape) ==1: flavor_features = flavor_features.reshape(1, -1) prediction = self.model.predict(flavor_features) probability = self.model.predict_proba(flavor_features)[0][1] returnprediction[0], probability defrecommend(self, user_preference, top_n=3): """基于用户偏好推荐菜品前3项""" self.dishes["predicted_like"] = self.dishes.apply( lambdarow: self.predict(np.array([row["sour"], row["sweet"], row["spicy"]]))[1], axis=1) recommended = self.dishes.sort_values("predicted_like", ascending=False).head(top_n) returnrecommended defanalyze_user(self, user_history): """分析用户历史偏好,生成用户偏好特征""" ifnotuser_history: returnnp.array([3,3,3]) history_array = np.array(user_history) avg_preference = np.mean(history_array, axis=0) returnavg_preference defvisualize_preferences(self, user_pref): """可视化用户偏好""" labels = ['酸','甜','辣'] values = user_pref plt.figure(figsize=(8,5)) plt.bar(labels, values, color=['#FF6B6B','#FFD166','#06D6A0']) plt.xticks(range(len(labels)), labels, fontproperties=ft) plt.xlabel('口味特征', fontproperties=ft) plt.ylabel('偏好值', fontproperties=ft) plt.title('用户口味偏好分析', fontproperties=ft) plt.ylim(0,6) plt.grid(axis='y', linestyle='--', alpha=0.7) plt.show() defplot_training_history(self): """绘制完整的训练历史图表""" ifnotself.train_accuracy: print("请先训练模型") return epochs_range =range(1,len(self.train_accuracy) +1) fig, (ax1, ax2) = plt.subplots(1,2, figsize=(15,6)) # 绘制损失曲线 ax1.plot(epochs_range, self.train_losses,'b-', label='训练集损失', marker='o', linewidth=2) ax1.plot(epochs_range, self.val_losses,'g-', label='验证集损失', marker='s', linewidth=2) ax1.plot(epochs_range, self.test_losses,'r-', label='测试集损失', marker='^', linewidth=2) ax1.set_xlabel('训练轮次', fontproperties=ft) ax1.set_ylabel('损失值', fontproperties=ft) ax1.set_title('训练损失曲线', fontproperties=ft) ax1.legend(prop=ft) ax1.grid(True, linestyle='--', alpha=0.7) ax1.set_ylim(0,1) # 绘制准确率曲线 ax2.plot(epochs_range, self.train_accuracy,'b-', label='训练集准确率', marker='o', linewidth=2) ax2.plot(epochs_range, self.val_accuracy,'g-', label='验证集准确率', marker='s', linewidth=2) ax2.plot(epochs_range, self.test_accuracy,'r-', label='测试集准确率', marker='^', linewidth=2) ax2.set_xlabel('训练轮次', fontproperties=ft) ax2.set_ylabel('准确率', fontproperties=ft) ax2.set_title('训练准确率曲线', fontproperties=ft) ax2.legend(prop=ft) ax2.grid(True, linestyle='--', alpha=0.7) ax2.set_ylim(0,1) plt.tight_layout() plt.show() defevaluate_model_performance(self): """评估模型整体性能""" ifnotself.train_accuracy: print("请先训练模型") return # 绘制完整的训练历史 #self.plot_training_history() # 计算平均准确率 avg_train_acc = np.mean(self.train_accuracy) avg_val_acc = np.mean(self.val_accuracy) avg_test_acc = np.mean(self.test_accuracy) # 绘制准确率对比图 accuracies = [avg_train_acc, avg_val_acc, avg_test_acc] labels = ['训练集','验证集','测试集'] plt.figure(figsize=(8,6)) bars = plt.bar(labels, accuracies, color=['#3498db','#2ecc71','#e74c3c'], alpha=0.8) plt.xticks(fontproperties=ft) plt.ylim(0,1) plt.ylabel('准确率', fontproperties=ft) plt.title('模型在不同数据集上的平均准确率', fontproperties=ft) # 在柱状图上添加数值标签 forbar, accuracyinzip(bars, accuracies): height = bar.get_height() plt.text(bar.get_x() + bar.get_width()/2., height +0.01, f'{accuracy:.4f}', ha='center', va='bottom') plt.grid(axis='y', linestyle='--', alpha=0.7) plt.show() # 输出性能分析 print("
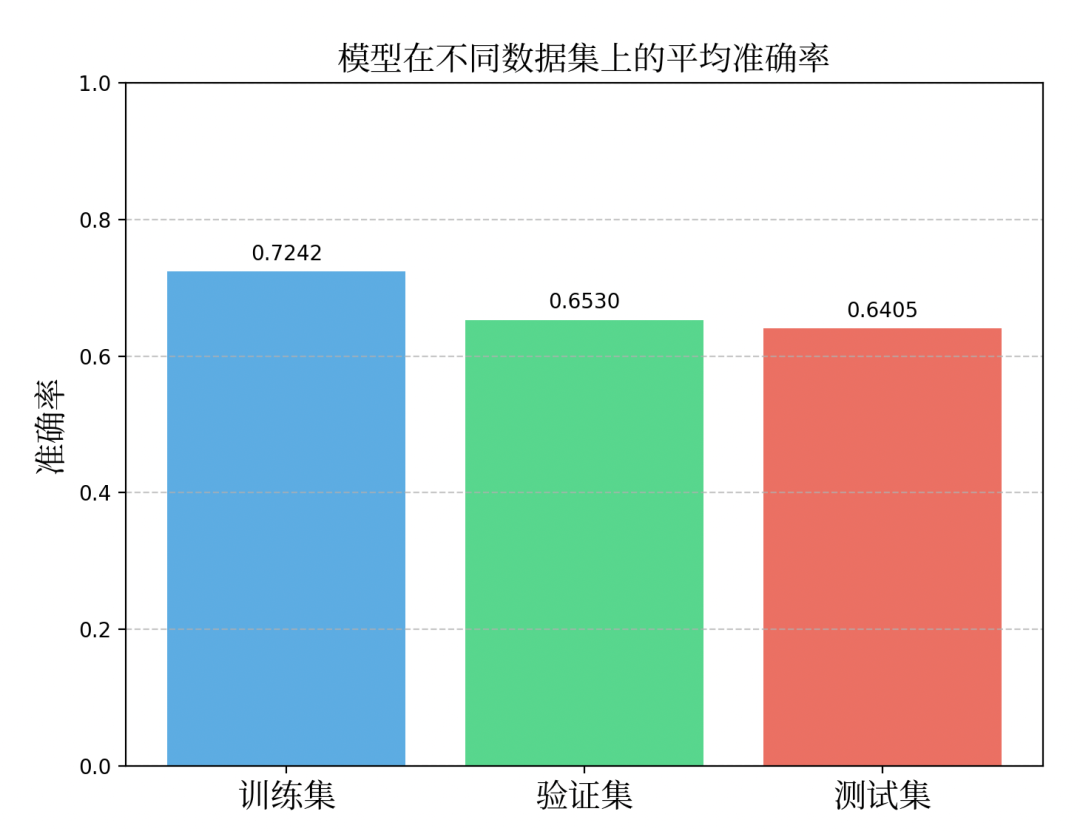
=== 模型性能分析 ===") print(f"训练集平均准确率:{avg_train_acc:.4f}") print(f"验证集平均准确率:{avg_val_acc:.4f}") print(f"测试集平均准确率:{avg_test_acc:.4f}") print(f"训练集-验证集差异:{abs(avg_train_acc - avg_val_acc):.4f}") print(f"验证集-测试集差异:{abs(avg_val_acc - avg_test_acc):.4f}") ifavg_train_acc > avg_val_acc +0.1: print("⚠️ 可能存在过拟合:训练集准确率明显高于验证集") elifabs(avg_train_acc - avg_val_acc) <0.05: print("✅ 模型泛化能力良好:训练集和验证集表现接近") else: print("📊 模型表现正常")#模块3:主程序《创建推荐系统》if__name__ =="__main__": recommender = FlavorRecommender() X, y = recommender.DATA(n_samples=2000) train_acc, val_acc, test_acc = recommender.train(X, y, epochs=10) # 减少训练轮数 # 评估模型整体性能 recommender.evaluate_model_performance() # 示例1:基于用户历史偏好推荐 print("
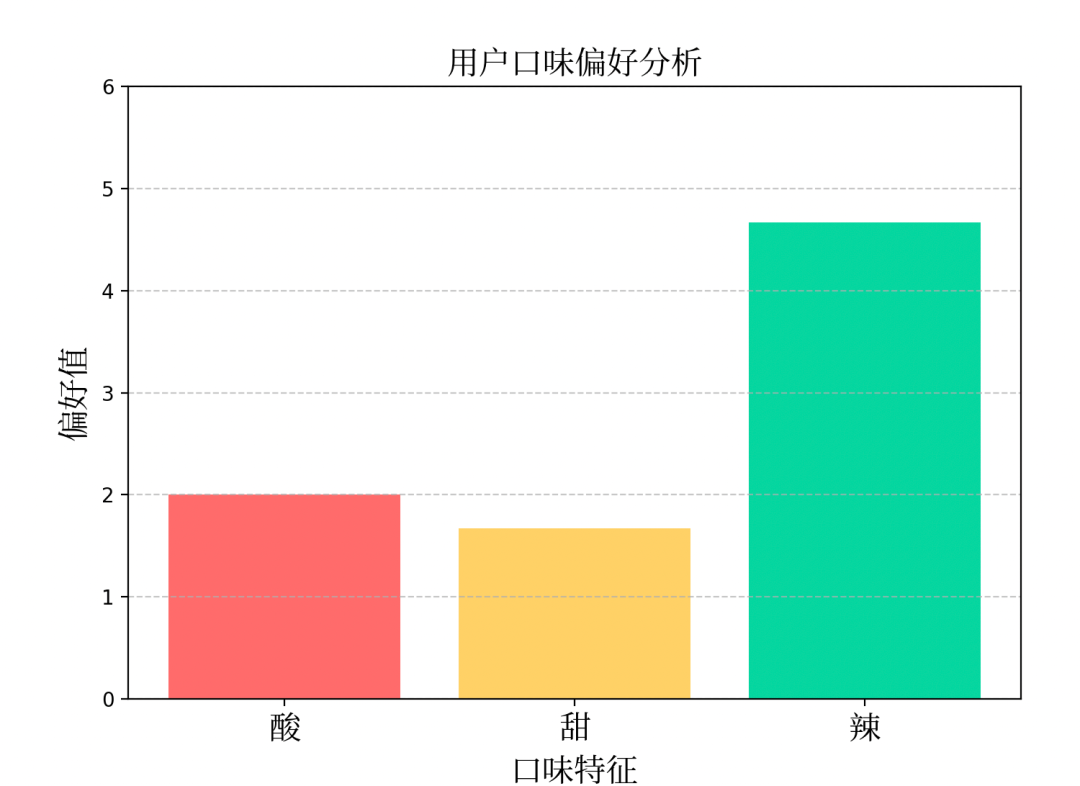
--- 示例1:基于用户历史偏好推荐 ---") user_history = [ [3,2,4], [2,1,5], [1,2,5] ] user_pref = recommender.analyze_user(user_history) print(f"用户平均口味偏好 (酸, 甜, 辣):{user_pref}") recommender.visualize_preferences(user_pref) recommendations = recommender.recommend(user_pref) print("
为您推荐的菜品:") fori, (_, dish)inenumerate(recommendations.iterrows(),1): print(f"{i}.{dish['name']}(酸:{dish['sour']}, 甜:{dish['sweet']}, 辣:{dish['spicy']}, " f"匹配度:{dish['predicted_like']:.2f})") # 示例2:为新用户推荐 print("
--- 示例2:为新用户推荐 ---") new_user_pref = np.array([3,3,3]) recommendations_new = recommender.recommend(new_user_pref) print("为新用户推荐的菜品:") fori, (_, dish)inenumerate(recommendations_new.iterrows(),1): print(f"{i}.{dish['name']}(酸:{dish['sour']}, 甜:{dish['sweet']}, 辣:{dish['spicy']}, " f"匹配度:{dish['predicted_like']:.2f})") # 示例3:预测特定菜品是否符合用户口味 print("
--- 示例3:预测特定菜品是否符合用户口味 ---") test_dish = np.array([4,5,1]) like, prob = recommender.predict(test_dish) print(f"对于酸{test_dish[0]}, 甜{test_dish[1]}, 辣{test_dish[2]}的菜品:") print(f"预测结果:{'喜欢'iflike ==1else'不喜欢'}(概率:{prob:.2f})")
© 版权声明
文章版权归作者所有,未经允许请勿转载。